A server receives security updates weekly for n weeks. There are m independent attackers each week; each attacker succeeds in breaching the server with probability p (independently). For each week:
- if the server remains secure, assign the week a score of +1;
- if the server is breached, assign the week a score of −1.
A trajectory is the cumulative sum of these weekly scores across n weeks. We want to:
- simulate many such random trajectories;
- count how many trajectories reach each possible total cumulative score after n weeks;
- show how the empirical counts converge to the theoretical distribution (derived from the binomial distribution) as n and number of simulations increase, and how they change when m increases.
Mathematical model and connection to a random walk
Weekly breach probability
With m independent attackers each with success probability p, the probability that no attacker succeeds in a week is q=(1−p)^m. We know that an attacker wins with probability p, then he loses with probability 1-p; if we want to find the probability that no attacks occur, we raise (1 – p) to the power of m, because for no attacks to happen, every potential attacker must fail to attack — that is, all attackers must be unsuccessful.
To find the probability that at least one attacker succeeds, we first compute the probability that no attacker succeeds. The probability that all of them fail is exactly q, the one that we saw above. Then, using the complement rule, the probability that at least one attacker succeeds is s=1−q=1−(1−p)^m. In other words, we subtract from 1 the probability that every attacker fails.
The probability that the server remains secure in a given week is q and s is the probability that the server is breached in a given week.
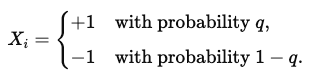
Assume the weeks are independent, they are independent and identically distributed. The cumulative score after n weeks is

This is a (possibly biased) simple random walk: each step is +1 with probability q and −1 with probability s.
The maximum possible score occurs when the server remains secure every week: Tmax=+n. The minimum possible score occurs when the server is breached every week: Tmin=−n.
However, not every integer between −n and +n can be reached; this because each step changes the cumulative score by exactly two units (+1−(−1)=2+1 – (-1) = 2+1−(−1)=2), the total score always has the same parity as n — that is, both even or both odd. Therefore, the set of possible final scores is:

Example
If n=10

If n=9

Rewriting via binomial random variable
Let Sn be the number of secure weeks (the number of +1 outcomes) in n weeks. Then Sn∼Binomial(n,q).
The relation between Tn and Sn is:

So there is a one-to-one mapping between the binomial count Sn (number of secure weeks) and the total score Tn.
Mean and variance

Dependence on m
Because q=(1-p)^m, changing m changes q dramatically:
- If p>0, as m→∞, q=(1-p)^m→ 0 and the server is almost always breached so the distribution concentrates near −n.
- For small p, q≈e^{-mp} (Poisson approximation), so increasing m exponentially decreases q.
The Divergence of n and m
- Large n: As the number of weeks increases, the number of independent “trials” for success/failure increases. This is a classic condition for the Central Limit Theorem to start applying to the sum of random variables (our cumulative score). The binomial distribution itself approaches a normal distribution for large n.
- Large m and its effect on q: As m increases, q = (1 – p)^m generally decreases, and s = 1 – (1 – p)^m generally increases, unless p is extremely small.
Figure Discussion – Effect of the Number of Attackers on Cumulative Score Trajectories

The figure above displays three sets of simulated cumulative-score trajectories corresponding to different numbers of attackers m=1,10,100.
Each line represents the evolution of the server’s cumulative score over 200 weeks, where each weekly increment Xi equals +1 if the server remains secure and −1 if it is breached during that week.
Scenario m = 1 – Almost symmetric random walk
In this scenario, there is only one attacker, so the weekly probability of staying secure is relatively high, approximately P(+1)≈0.6.
The resulting trajectories fluctuate around zero, with both upward and downward movements occurring frequently. The walk resembles a nearly unbiased random walk with a slight positive drift.
This indicates that when there is only a single attacker, the server experiences a roughly balanced mix of secure and breached weeks, with no strong cumulative trend in either direction.
Scenario m = 10 – Emergent negative bias
When the number of attackers increases to ten, the weekly probability of remaining secure decreases substantially, to about P(+1)≈0.3.
In this case, the cumulative-score paths exhibit a clear downward drift: most trajectories tend to lose score over time, though random fluctuations are still visible.
This reflects a situation where the system becomes increasingly vulnerable, and breaches begin to dominate over successful defenses as multiple attackers act simultaneously each week.
Scenario m = 100 – Strong negative drive
For one hundred attackers, the chance of a secure week becomes extremely small, P(+1)≈0.005.
All trajectories collapse into a consistently decreasing pattern, almost a straight line toward the minimum possible score (−n). Random variation effectively disappears because every week almost certainly results in a breach.
This represents a regime of systemic failure, where the defense mechanisms are overwhelmed and the server cannot sustain any stable or positive performance over time.
Overall observation across the three graphs
The three panels together demonstrate how increasing the number of independent attackers m transforms the statistical behavior of the server’s cumulative score:
- For small m, the process behaves like a nearly symmetric random walk with small drift.
- As m grows, the bias becomes strongly negative, shifting the random walk from stochastic fluctuation to a monotonic decline.
- In the limit of very large m, the random component vanishes, and the outcome becomes almost deterministic, dominated by persistent breaches.
This progressive change illustrates how the weekly secure probability q = (1-p)^m rapidly decreases as mmm increases, emphasizing the nonlinear amplification of risk when multiple attackers act independently against the same target.